Background
Imagine a flask filled with nutrient broth and a population of bacteria growing inside. At some point an experimenter adds an antibiotic to the flask. The bacterial culture quickly clears as the majority of bacterial cells die because of the added antibiotic. However, after a little more time, the experimenter sees the bacterial culture recover due to the growth of antibiotic resistant cells. The experimenter ponders the origin of these resistant cells. She formulates two working hypotheses:
- Directed Mutation: The resistant cells arose in response to the added antibiotic.
- Spontaneous Mutation: The resistant cells arose spontaneously before the addition of the antibiotic.
She realizes that the answer to her question has important consequences. Natural selection requires variation among individuals. Such variation arises from mutation. Does the variation originate in response to selective pressures (hypothesis 1) or at random (hypothesis 2)?
The experimenter finds herself in a quandary, because the resistant cells do not look different than sensitive cells (the cell dimensions are the same and both cell types form similar looking colonies on a Petri dish). Therefore, the only way to tell whether a cell is resistant is to apply the antibiotic and determine whether it lives or dies. This makes it difficult to determine whether resistant cells arise before the antibiotic is applied (as such cells can only be detected after antibiotic application). How is she to distinguish between her hypotheses?
In 1943 (10 years before the discovery of the structure of DNA), Salvador Luria and Max Delbrück designed an elegant experiment to distinguish between these hypotheses. In this lab, you will repeat this classic experiment.
Bacterial cells reproduce by asexual splitting, so we can represent the growth of the bacterial population as an inverted branching tree, where the branches connect a mother cell to its daughter cells (see figure below). Luria and Delbrück realized that there would be important information gained if several replicate bacterial populations were simultaneously initiated (in the figure below there are 6 replicate populations, but you will use 24).
Under the directed mutation hypothesis, when the antibiotic is applied (the dashed red line in the figure) each sensitive cell (gray oval) has some small probability of mutating to a resistant state (red oval). There will be some variance in the number of resistant cells between replicate populations, but this variance is not expected to be very large.
Under the spontaneous mutation hypothesis, mutation can occur anytime before the antibiotic is applied. Again the probability of mutation is small. Under this model, most mutations will occur when the bacterial population is large (the more cells present, the more chances for mutation). Occasionally a mutation may occur early in the population growth (higher up on the "inverted tree"). Since all the daughter cells of this mutant will also be resistant, this will generate a population with an extraordinarily high number of resistant cells revealed when the antibiotic is applied. Such an outcome is termed a "jackpot," analogous to a slot machine that rarely pays off, but occasionally pays off big. In the figure below, replicate 5 is a jackpot population (an early mutation led to a large number of resistant cells at the time of antibiotic application). Due to the existence of such jackpots, the variance in the number of resistant cells over the replicates is expected to be large (most replicates will only have a few resistant cells, whereas a few replicates will have a large number of resistant cells).
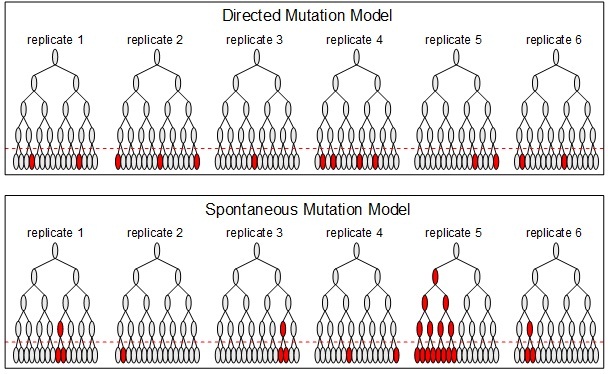
A cartoon to illustrate the distribution of resistant cells across replicates under the two hypothetical models.
Lab Overview
In this lab, you will receive 24 replicate populations of the bacterium Escherichia coli, grown up the night before the lab. These populations grew in the absence of any antibiotics. You will distribute each population (in its entirety) on an agar-filled Petri dish impregnated with the antibiotic rifampicin. Only rifampicin resistant cells (denoted rifR) will form colonies on these plates. After 48 hours of incubation, counting the colonies will tell you how many rifR cells there were in each population. The variance in these numbers will help distinguish between the directed mutation hypothesis and the spontaneous mutation hypothesis.
Lab Logistics
This lab will take two days to complete. The Day 1 session (Tuesday) should take between 1 and 1.5 hours. The Day 3 session (Thursday) will only require one or two people from each group to count the Petri dishes from Day 1 (this should take less than 1 hour). The antibiotic rifampicin is toxic, so always wear gloves when handling the rifampicin impregnated dishes.
Day 1 (Tuesday)
Daily Overview
Plate bacteria from several replicate populations initiated the day before.
Materials
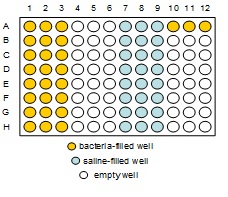
- 1 96-well microtiter plate (wells A1-H1, A2-H2, A3-H3, A10, A11, and A12 contain 200µL fully grown bacterial culture (BK 26); wells A7-H7, A8-H8, and A9-H9 contain 270µL saline; and the rest of the wells are empty).
- 24 Petri dishes with LB agar + rifampicin (orange)
- 6 Petri dishes with LB agar (yellow)
- Pipetteman and tips
- 18mm test tube with sterile glass beads
- 18mm tube rack
- Beaker with 95% ethanol (for disposing of the glass beads)
- 70% ethanol spray bottle & Kimwipes
- Waste bucket
- Burner & striker
Protocol
- Your TAs will describe how to safely handle rifampicin dishes.
- Put on a set of gloves. Label each Petri dish containing LB agar + Rifampicin (orange colored Petri dishes):
- Label each Petri dish with just LB agar (yellow):
- Label your microtiter plate along the side: "group name, date."
- Sterilize bench with ethanol (from bottle). After it evaporates, turn on gas and light burner.
- Using Sterile Technique, place 6-8 glass beads onto all 30 Petri dishes.
- Using a sterile tip, pipette 200µL from microtiter well A1 and dispense it into Petri dish A1. Dispose of tip. Shake the Petri dish to spread out the bacteria. When glass beads appear dry, flip the dish over to get the beads on the lid, then gently pour them into the beaker from the lid. Repeat this for all 24 wells in the range A1-H3. (Note: There is 200µL in each well so be careful to get all the liquid out of each well.)
- Perform a Dilution Series on the cultures in A10, A11 and A12 using columns 7, 8, and 9 of the microtiter plate, respectively.
- Plate 100µL of the 10-6 dilution from column 7 (from well F7) onto LB agar Petri dish "10, 10-6" and plate 100µL of the 10-7 dilution from column 7 (from well G7) onto LB agar Petri dish "10, 10-7". Repeat this step for column 8 (using dishes "11, 10-6" and "11, 10-7") and column 9 (using dishes "12, 10-6" and "12, 10-7").
- TURN OFF GAS. Clean up lab bench. Take your Petri dishes to the incubator (they will incubate for ~48 hours).
Day 3 (Thursday)
1 person/group needed
Daily Overview
Count the colonies on the Petri dishes.
Materials
- 30 Petri dishes with colonies (from Day 1 in 37°C incubator)
- clicker counters
- gloves
- sharpie marker
Protocol
- Count the number of colonies on each dish (using a sharpie and clicker counter) and record the number on the dish and in your lab notebook.
- Enter the data into the appropriate Class Data Google Sheet, which can be found under the Data tab on the course website. Please note that at the appropriate Google Sheet link, there are two sheets for your data: "Rif Plate Colony Counts" and "LB Plate Colony Counts". The tabs for these sheets are on the bottom left of the webpage. Make sure to enter your data into the correct sheet.
Putting it all together
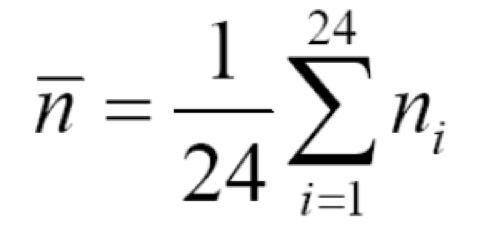
At this point you have colony counts from various Petri dishes. Each colony originates from a single cell. Let ni be the number of rifR cells from the ith population (i goes from 1 up to 24, counting each of the populations you plated onto LB+rifampicin dishes). The average number of rifR cells over all of your replicates is:
The variance in the number of cells over all of your replicates, σn2, is
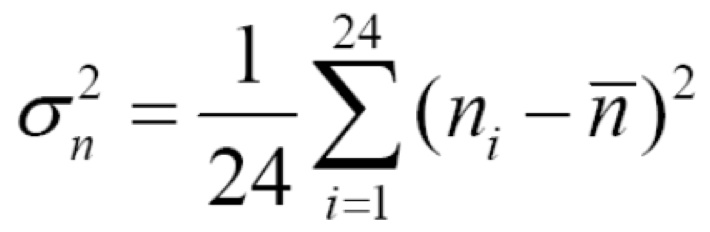
Under the directed mutation hypothesis, the average and variance should be approximately equal. Under the spontaneous mutation hypothesis, the variance should be larger than the average. While the formulas above are written to compute the average and variance of your group's data, you will actually have access to data for the entire class. For your lab report, it is recommended that you analyze the data from all groups in the class. We will discuss ways to summarize, visualize, and statistically analyze this data set a few weeks after the Luria-Delbrück Lab.
If some of your rifampicin dishes had zero colonies, you will be able to compute the mutation rate (per bacterial doubling). Let f be the fraction of your rifampicin dishes with zero colonies (for example, if 6 of 24 plates had zero colonies, then f=¼). The day before your lab, the TA placed approximately N0=25 sensitive cells into each of the 24 wells you plated. Let N be the total number of cells in the microtiter well after 24 hours of incubation (that is, right when you started the lab). From your counts on the LB dishes (the dishes without the rifampicin), you should be able to figure out the number of cells in wells A10, A11 and A12—make sure to account for the dilutions you performed! Set N equal to the average of the number of cells from these three wells. The mutation rate, µ , is
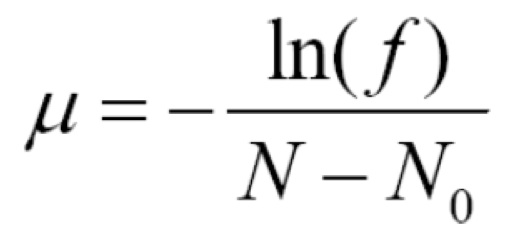
Again, the calculation of mutation rate could be done with the entire class' data (and will tend to be more accurate). We will discuss how to perform this calculation when we discuss Data Processing, Visualization, and Analysis (a few weeks after the Luria-Delbrück Lab).
Questions
- Report your average and variance of rifR cells. Compute the rate of mutation to rifampicin resistance.
- Did your data support the directed mutation hypothesis or spontaneous mutation hypothesis?
- Suppose that all of your rifampicin dishes had colonies. Can you compute µ above? If not, how would you change the experiment so that µ can be computed?
- Someone tells you that ultraviolet light acts as a mutagen (that is, it increases mutation rate). How might you use the Luria-Delbrück experiment to test this idea?
- Assume that the mutation rate for streptomycin (another antibiotic) is approximately the same as that which you computed for rifampicin. If you repeated the Luria-Delbrück experiment using dishes impregnated with both rifampicin and streptomycin, what would you expect your results to be? Make sure to explain your reasoning.
- Bonus question: Give a derivation for the expression for the mutation rate (µ):