Multicellularity Lab
(Modified from an original protocol by William C. Ratcliff, Nicholas Beerman and Tami Limberg)
Background
The evolution of multicellularity was one of the major transitions in the history of life. It allowed for an increase in complexity via the partitioning of cells for specialized functions, all working together within one entity. Multicellular organisms could move farther, grow bigger, and survive in more diverse ecosystems. Despite these advantages, we know very little about how organisms made the switch from unicellularity to multicellularity. Amazingly, we do know it happened repeatedly throughout life’s history, in at least 2 dozen independent evolutionary events. Yet how did these events occur? What were the selective benefits, if any, to the first multicellular organisms? What environmental conditions might have favored this transition? These are some of the questions that scientists are still grappling with, and that you will explore in this lab.
Fossil evidence suggests that multicellular organisms first appeared over a billion years ago. Even the most recent transition we know of happened over 200 million years ago. This makes it especially difficult to study the origin of multicellularity in a lineage, because the accumulation of so many genetic changes over this span of time makes it hard to determine which changes were important during the actual transition. While we may not be able to determine exactly how any one of these transitions occurred in the past, we can artificially recreate similar events in order to infer how these transitions might have happened.
In the paper you read for this week, Ratcliff et al. (2012) carried out a novel experiment to evolve a simple form of multicellularity in the lab, starting with single-celled microbes. The authors created an environment that favored mutant strains that formed clusters of cells (the first step in the transition to multicellularity) by subjecting Baker’s yeast (Saccharomyces cerevisiae) to daily selection for fast settling through liquid medium. Within just a few weeks, yeast that formed snowflake-shaped clusters of cells (Figure 1) evolved and displaced their single-celled ancestors. “Snowflake” yeast display several hallmarks of multicellularity, including juvenile and adult life stages, determinate growth, and a rudimentary cellular division of labor utilizing programmed cell death. Similar experiments have since been done on the single-celled alga Chlamydomonas reinhardtii, with similar results (Ratcliff et al. 2013).
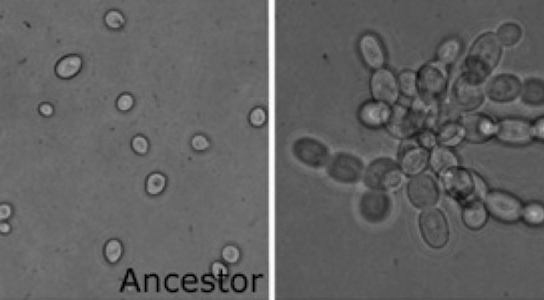
Figure 1: The Ratcliff et al. experiment started with single-celled yeast (left) and multicellular snowflake yeast (right) evolved under selection for fast settling (photo credit: Will Ratcliff)
While these experiments have demonstrated that early steps in the transition to multicellularity can be observed, selection for fast settling was probably not the primary driver of multicellularity in nature. Are there more natural environmental conditions that might have selected for multicellularity? Because the evolution of multicellularity has occurred so many times throughout evolutionary history one might hypothesize there were many different environments for which being multicellular conferred a fitness advantage. However, one could also ask why we don’t see multicellularity arise even more frequently. Why did some lineages retain their unicellularity? Again, we return to the concept of fitness tradeoffs. What are the tradeoffs of multicellularity?
Lab Overview
This lab contains two parts, both of which allow you to explore tradeoffs to being multicellular.
1. To explore a potential disadvantage to being multicellular, you will perform a growth assay of unicellular and snowflake yeast to test whether one has a growth advantage over the other.
2. To explore the advantages of multicellularity in the face of a more “natural” selective pressure you will use unicellular and snowflake yeast to test whether predation by small-mouthed organisms (Figure 2) can select for cluster formation.
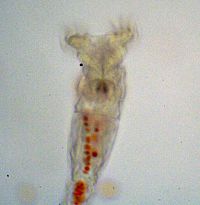
Figure 2: Rotifer after eating red-dyed unicellular yeast
Lab Logistics
Day 1 (Tuesday)
Daily Overview
Plating of multicellular (M) and unicellular yeast (U) on YPD plates, at different times; observe rotifer predation on both unicellular and multicellular yeast.
Materials
- 18mm test tube rack containing:
- 2 18mm tubes of 4 ml Saccharomyces cerevisiae unicellular yeast (labeled "U")
- 2 18mm tubes of 4 ml Saccharomyces cerevisiae snowflake yeast (labeled "M")
- 1 18mm sterile tube with glass beads for plating
- 8 Petri Dishes with YPD agar
- One 96-well microtiter plate (filled with 270µL of .86% saline in each well)
- Pipettemen and sterile tips
- 2 compound microscopes
- 2 depression slides
- 1 flat slide
- coverslips
- 1 eppendorf tube containing methylene blue dyed multicellular yeast
- 1 eppendorf tube containing Congo red stained unicellular yeast
- Beaker with 95% ethanol (for disposing the glass beads)
- 70% ethanol spray bottle & Kimwipes
- Waste container
- Burner & striker
- Sharpie markers for labeling your Petri dishes and tubes
- Gloves
Protocol
Initializing the growth tubes
- Two hours before the first lab section meets, your instructional team will initiate a set of 12 U (unicellular) and 12 M (multicellular) monocultures. The team will also dilute and plate out samples from these monocultures, which will give the t=0 time point for the growth curves for each yeast strain.
Diluting and plating for either the (t=2) or (t=4) time point
- Your TA, PF or instructor will retrieve two unicellular monocultures (hereafter labeled Ui and Uj) and two multicellular monocultures (hereafter labeled Mi and Mj) from the incubator. Note the letters i and j will be distinct numbers between 1 and 12. On all your labeling, please use the numbers (not the letters i and j) of the tubes your group is given. If your lab section starts at 10:30am, your “timepoint” will be “t=2” and if your lab section starts at 12:30pm, your “timepoint” will be “t=4”. On all your labeling, please use either “t=2” or “t=4” to indicate your time point.
- Based on the numbers of the U and M monocultures you are given, and the time point of your lab section, label your YPD Petri dishes as follows:
- “Ui (timepoint) -2 (50uL) group_name date”
- “Ui (timepoint) -3 (100uL) group_name date”
- “Uj (timepoint) -2 (50uL) group_name date”
- “Uj (timepoint) -3 (100uL) group_name date”
- “Mi (timepoint) -2 (50uL) group_name date”
- “Mi (timepoint) -3 (100uL) group_name date”
- “Mj (timepoint) -2 (50uL) group_name date”
- “Mj (timepoint) -3 (100uL) group_name date”
- Based on the numbers of the U and M monocultures you are given, and the time point of your lab section, label your microtiter plate with “(timepoint) group_name date”. On the top of column 1, write Ui. On the top of column 2, write Uj. On the top of column 3, write Mi. On the top of column 4, write Mj. (Again, i and j should be the numbers on the tubes you received).
- Sterilize your bench, and once the ethanol has dried, light your burner.
- Load a tip, vortex the Ui tube and immediately pipette 30uL into the well in row A and the column you labeled “Ui”. Discard tip.
- Load a tip, vortex the Uj tube and immediately pipette 30uL into the well in row A and the column you labeled “Uj”. Discard tip.
- Load a tip, vortex the Mi tube and immediately pipette 30uL into the well in row A and the column you labeled “Mi” (the reason the pipetting occurs directly after the vortexing is because the yeast can settle to the bottom or the tube, especially if the strain is multicellular). Discard tip.
- Load a tip, vortex the Mj tube and immediately pipette 30uL into the well in row A and the column you labeled “Mj”. Discard tip.
- Alert your TA, PF or instructor that your group has finished with your first tenfold dilutions, and one of these instructors will take your monocultures (Ui, Uj, Mi and Mj) back to the spinner in the standing incubator.
- For each of the four dilutions that you have initiated in row A of your microtiter plate, continue the dilution series to 10^(-3) (i.e., row C). Make sure to gently mix each well (through aspiration and dispensing) before transferring to the next well in the dilution series.
- Add glass beads to all eight of your YPD Petri dishes (6-8 beads per dish)
- Set the volume of your pipetteman to 50uL. Aspirate 50uL from the well corresponding to the 10^(-2) dilution (row B) of the column labeled “Ui” into the dish labeled “Ui (timepoint) -2 (50uL) group_name date”. Shake the dish, using the beads to distribute the dilution over the surface of the agar.
- Set the volume of your pipetteman to 100uL. Aspirate 100uL from the well corresponding to the 10^(-3) dilution (row C) of the column labeled “Ui” into the dish labeled “Ui (timepoint) -3 (100uL) group_name date”. Shake the dish, using the beads to distribute the dilution over the surface of the agar.
- Repeat steps 12 and 13, with the dilution series for Uj, Mi and Mj using the appropriately labeled Petri dishes. Please check that you are using the appropriate volume for every Petri dish, as these are changing from dish to dish!
- Return the beads to collection beaker with 95% ethanol.
- Put your dishes in the incubator (agar side up) in the appropriately marked area.
- Your group will be assigned one U monoculture and one M monoculture to count Petri dishes for on Thursday. Make sure to write down this number of the monocultures you'll be counting.
Diluting and plating for the (t=6) and (t=8) time points
- After your lab sections meet, your instructional team will dilute and plate the set of 12 U and 12 M monocultures, which will give the t=6 and t=8 time points for the growth curves for each yeast strain.
Rotifer Predation There are two components to this part of the lab that can be done simultaneously by different members of your group (although each member should take a turn with both parts).
Part 1: Observing rotifer predation
- Pipette 100 uL of rotifers onto a depression slide (note: get rotifers from bottom of jar with some debris if you can).
- Invert the tube containing the blue stained multicellular yeast a few times to mix, then pipette 5 uL from this tube to the center of the depression slide (discard tip).
- Invert the tube containing the red stained Unicellular yeast a few times to mix, then pipette 5 uL (with a new tip) from this tube to the same area of the depression slide that you discarded the blue stained multicellular yeast (discard tip).
- Add coverslip and place slide on microscope stage.
- Observe rotifers feeding on the yeast, note how they are feeding and what they are eating. Where is their mouth? How are they moving? What do they do after they eat something? If you are having trouble focusing on your rotifers and yeast, raise your hand and a TA will help you.
Part 2: Quantifying rotifer predation
- Using a new depression slide, repeat steps #1-3 from Part 1 (Do NOT place a cover slip over over the depression). We recommend that you do this twice on the same slide, so that you have two areas of the slide in which to look for rotifers.
- Let the mixture sit for three minutes.
- Pipette up 20 uL of this mixture, but only expunge approximately half the liquid on to a flat slide to avoid overflow on the slide.
- Add coverslip and place slide on microscope stage.
- Observe and take photos of at least 5 individual rotifers/person (~20 per group) so that you can see the number of yeast cells in each rotifer's gut. You should be able to use the camera on your phone to do this through the microscope eyepiece. If nobody in your group has a camera phone, we will provide one for you.
- Count and record the number of blue cells and red cells in each rotifer's gut. Count the total number of dyed yeast cells in your photos (whether they are inside or outside the rotifers). All of your data can be entered under the "Rotifer Observations" tab of the relevant Google sheet, which can be found at the Data page of the course website.
Day 3 (Thursday)
1-2 people/group needed, approximately 1/2 hour
Daily Overview
Counting of the time point data
Materials
- Sharpie markers
- Gloves
- Clicker Counter
- YPD plates with yeast colonies
Count different time point plates
- Retrieve from the incubator all Petri dishes corresponding to the number of the U and M monoculture that your group was assigned on Tuesday. This will include t=0, t=2, t=4, t=6 and t=8 plates.
- Count the number of colonies on each dish (using a sharpie and clicker counter) and record the number on the dish.
- Enter the data into the spreadsheet under the "Monoculture Time Series" tab of the relevant Google sheet, which can be found at the Data page of the course website.
Putting it All together
Yeast Competition From your colony counts, you should be able to determine which type of yeast (the unicellular or multicellular) grew faster when alone. Calculate the growth rates for each strain (you will likely use a regression approach to calculate these growth rates). Given that relative fitness is a ratio of growth rates, calculate relative fitness.
Rotifer Predation Calculate the proportion of multicellular yeast consumed and use a chi-square test to determine if the difference of unicellular and multicellular cells consumed by the rotifers is significant.
Questions
- Was one type of yeast preferentially eaten by the rotifers? Explain what might account for a feeding bias (or lack thereof).
- Report fitness (some measure of growth) from the monoculture growth tubes, what does this pattern tell you?
- To initiate the monocultures, the unicellular yeast had to be diluted so that both U and M monocultures started at around the same density for our growth assay. Why was such a dilution necessary, and what does this tell you?
- Do you think it is better to be a unicellular or multicellular yeast? What are the advantages and disadvantages of being either? (Your answer should include potential advantages/disadvantages that we did not directly test in this lab.) Which type do you think is more "fit" and why?
- Do you agree that the snowflake yeast is an example of a multicellular organism? If yes, what further elaborations would you expect? If no, what would need to happen to convince you that the snowflake yeast was multicellular?
Bonus Questions (.5 points each):
Part A
- Consider Ratcliff et al. (2012). If you wanted to select for yeast clusters of either 1) small, 2) large, or 3) varying size. How would you alter the experiments done in this paper? Your answer should address each of the above scenarios (1, 2, and 3).
Part B
- Consider Ratcliff et al. (2012). What additional adaptations, apart from larger cluster size, would you expect to see evidence of? Come up with at least two additional phenotypic changes and clearly articulate why you would expect these changes to occur.